EP28: Your Microphone Is a Damped Oscillator
后续拓展
Overview
Every recording engineer knows that swapping a microphone changes the sound — but why? The answer is not marketing, not mystique, and not simply “expensive = better.” It is a second-order ordinary differential equation. The thin membrane inside any microphone is a damped harmonic oscillator: an elastic restoring force pulls it back, an inertial mass resists acceleration, and air damping bleeds away energy. These three forces combine into a single ODE whose solution determines everything you hear.
This episode derives that ODE from first principles, extracts the two dimensionless parameters that govern microphone character — natural frequency and quality factor — and shows how the resulting transfer function produces the Bode-plot “fingerprint” of a microphone. We then add the two further dimensions of microphone design: polar pattern (which directions are captured) and transduction mechanism (displacement vs. velocity sensing). All three dimensions resolve to the same mathematical object: a transfer function, or a product of transfer functions.
中文: “同一个歌手,同一句歌词,一支SM五十八,一支Neumann U八七。换了麦,像换了一个嗓子。这不是玄学,不是贵的就更好,是物理。”
Prerequisites
- 波动方程与傅里叶分析(EP02) — the wave equation as the origin of the forcing term ; Fourier decomposition of signals into frequency components
- 歌者共振峰(EP15) — the singer’s formant near 3 kHz as a natural energy concentration; this episode’s microphone peak interacts directly with that formant
Definitions
Let denote the displacement of a membrane of mass , subject to an elastic restoring coefficient , a viscous damping coefficient , and an external forcing . Newton’s second law gives the damped harmonic oscillator ODE:
The natural (angular) frequency is
and the damping ratio is
Dividing through by and writing , the ODE becomes the standard form:
Worked example. A condenser capsule has a membrane of effective mass kg and elastic stiffness N/m. Then rad/s, corresponding to kHz — right in the presence band exploited by the singer’s formant from EP15 .
The quality factor (Q factor) of a damped oscillator is defined as
Physically, measures the ratio of energy stored to energy dissipated per radian of oscillation. Three regimes:
- (i.e. ): overdamped — returns to equilibrium without oscillating
- (i.e. ): critically damped — fastest non-oscillatory return
- (i.e. ): underdamped — rings at angular frequency ; a gain peak appears in the frequency response
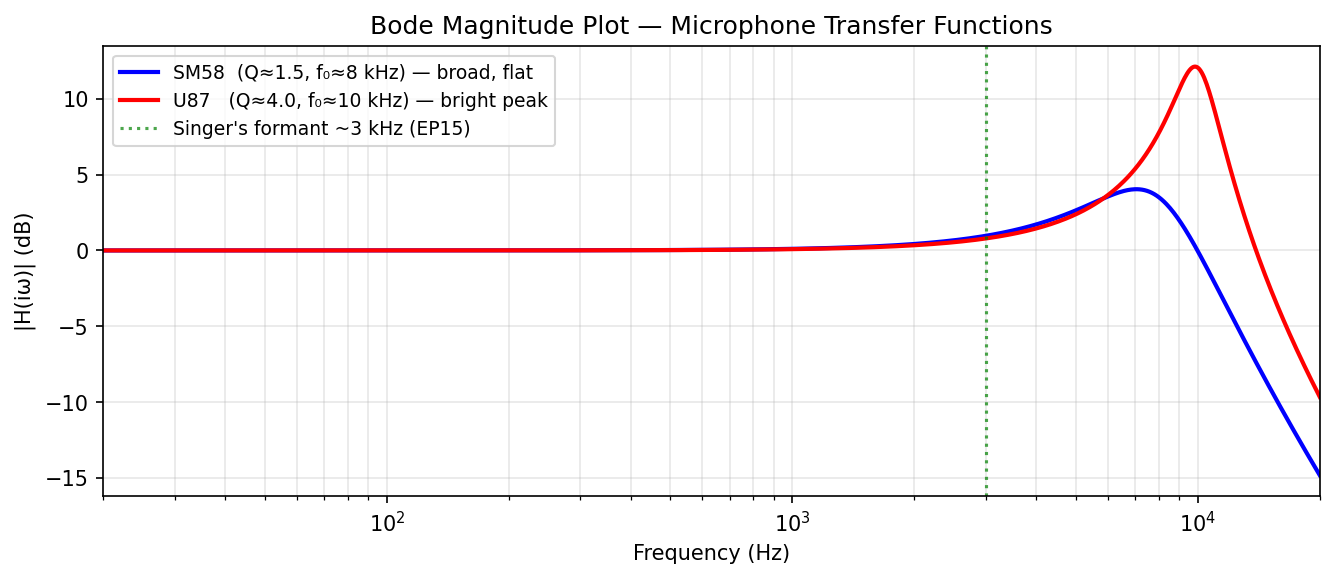
Worked example. The Shure SM58 has , so . Since , the SM58 membrane is underdamped and exhibits a gain peak — but with low the peak is broad and the response stays nearly flat across the vocal range. The Neumann U87 has to , giving a narrow bright peak near 10 kHz.
Taking the Laplace transform of the standard-form ODE (with zero initial conditions), and denoting the Laplace variable by , the transfer function of the damped harmonic oscillator is
The frequency response is obtained by substituting (where and is the real angular frequency):
The magnitude response (Bode gain plot) is
Worked example. At , (0 dB, unity gain at DC). At , . So the on-resonance gain equals the Q factor in linear units, or dB. For : gain at resonance = 9.5 dB.
The following script generates Bode magnitude plots contrasting a broad SM58 response (Q ≈ 1.5) with the sharper U87 presence peak (Q ≈ 4), overlaid with the singer’s formant reference from EP15:
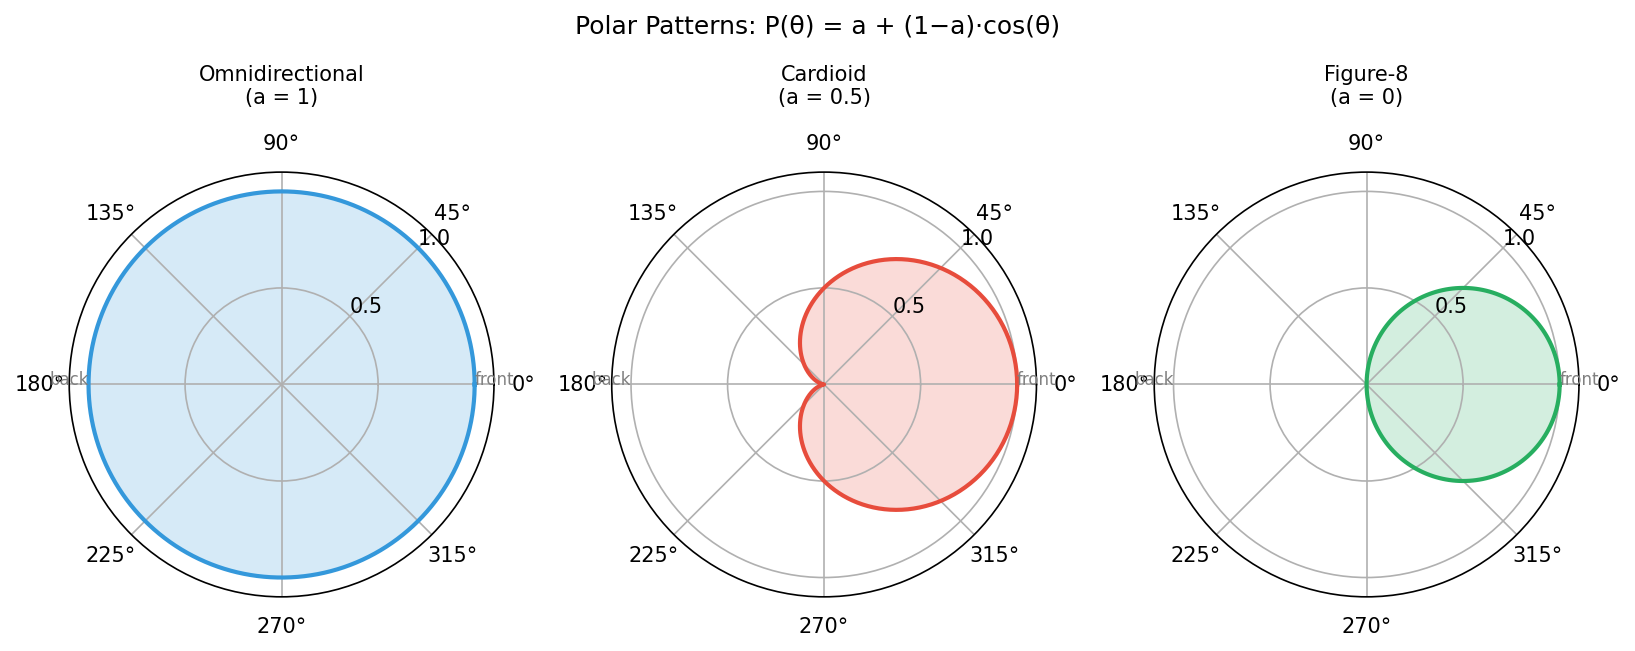
The directional sensitivity pattern of a microphone is described by the polar pattern function
where is the omnidirectional component weight. Special cases:
| Name | On-axis (0°) | Rear (180°) | Null | |
|---|---|---|---|---|
| 1 | Omnidirectional | 1 | 1 | none |
| 0.5 | Cardioid | 1 | 0 | 180° |
| 0 | Figure-8 (bidirectional) | 1 | −1 | ±90° |
| 0.37 | Supercardioid | 1 | −0.26 | ±125° |
The cardioid pattern is realised physically by combining a pressure sensor (omnidirectional) with a pressure-gradient sensor (figure-8) and summing their outputs with equal weight.
The following script generates polar diagrams for all three canonical patterns — omnidirectional, cardioid, and figure-8 — directly from the formula :
Main Theorems
For the standard second-order transfer function , a local maximum of in exists if and only if . When it exists, the peak occurs at
and the peak gain is
Let and define
so that . Maximising is equivalent to minimising .
Differentiate with respect to :
Setting :
Since we require , a peak exists only when , i.e. .
Substituting back into :
Therefore
The second derivative confirms this is a minimum of , hence a maximum of .
Starting from the standard-form ODE
with zero initial conditions , the Laplace transform yields
The two poles are located at , and lie in the left half-plane (system is stable) if and only if .
Apply the Laplace transform linearity and the differentiation rule , :
Factor :
Dividing both sides by and noting that the denominator factors as with roots from the quadratic formula gives
Real part of each pole is for , confirming BIBO stability.
A condenser microphone senses membrane displacement ; its output is proportional to in the Laplace domain. A dynamic (moving-coil) microphone senses membrane velocity ; its output is proportional to .
Their frequency responses along the frequency axis differ by a factor of :
In magnitude: .
Consequently, relative to the displacement response, the velocity (dynamic) response rises at +6 dB/octave at low frequencies and falls at −6 dB/octave at high frequencies above resonance.
The induced EMF in a dynamic microphone coil moving through a magnetic field of strength with effective wire length is
Taking the Laplace transform: (using the differentiation rule). The transfer function from forcing to output voltage is therefore
Evaluating on the imaginary axis: .
Taking magnitudes and ignoring the constant : .
The factor corresponds to a slope of dB/decade = dB/octave in the pass-band below resonance. Above resonance the denominator of grows as , so , i.e. dB/octave.
Numerical Examples
SM58 peak location. The Shure SM58 has , so . The condition for a peak is : satisfied. Peak location relative to natural frequency:
So the SM58 peak sits about 12% below the natural frequency — the resonance is pulled slightly down by damping. Peak gain:
That is dB — a gentle broad hump.
Neumann U87 peak sharpness. With , :
Peak gain: , i.e. about 12.1 dB — a clearly audible narrow brightness spike near rad/s.
Polar pattern: cardioid front-to-back ratio. With , the front () gain is . The rear () gain is : perfect rear null. The −3 dB point occurs where : , giving , .
Formant interaction. The singer’s formant from EP15 concentrates vocal energy near 3 kHz. If a microphone’s rad/s but with a broad skirt extending down to 3 kHz, the microphone gain at 3 kHz is (using the transfer function magnitude formula with , ):
About 0.6 dB lift — modest, but stacked on top of the singer’s formant, the combined effect is a noticeable presence boost.
Musical Connection
Choosing a microphone is choosing a transfer function product.
Every microphone in the signal chain adds its transfer function to the vocal transfer function . What arrives at the preamp is the product . The engineer’s intuitive vocabulary — “presence,” “air,” “warmth,” “proximity effect” — maps directly onto the shape of :
- Presence = a mid-high peak (3–8 kHz), aligning with the singer’s formant from
- Air = a narrow high-frequency peak above 10 kHz (high )
- Warmth = a low-frequency shoulder below 200 Hz (low )
- Proximity effect = a dynamic microphone’s inherent bass boost when used close-up, arising from near-field pressure-gradient enhancement of the velocity signal
The SM58/U87 contrast encodes the engineering trade-off: high gives distinctive character but requires careful placement; low is forgiving but generic. Neither is “better” — they are different poles in the complex -plane.
Connection forward. In
, the Helmholtz resonator that absorbs low-frequency room modes is governed by the identical ODE with a different physical interpretation of (air mass in the neck) and (restoring compressibility of cavity air). In
, the biquad EQ filter is the digital implementation of the same transfer function — discretised via the bilinear transform.
Limits and Open Questions
-
Membrane non-linearity. The ODE of Definition 28.1 assumes a linear elastic restoring force (Hooke’s law). Real membranes at high sound pressure levels exhibit stiffness hardening (), producing even-harmonic distortion. This is the origin of microphone THD specifications and is not captured by the linear transfer function.
-
Distributed membrane modes. The lumped-mass model treats the membrane as a point mass. A real circular membrane (governed by the two-dimensional wave equation in polar coordinates) has infinitely many normal modes — Bessel functions — each contributing a separate resonance peak. The transfer function of Definition 28.3 approximates only the dominant lowest mode.
-
Proximity effect and directional microphones. The pressure-gradient (figure-8) component of a cardioid pattern is inherently a near-field-dependent signal. At close distances the pressure-gradient term grows as rather than , causing a bass boost that is not captured by the far-field polar pattern . A complete model requires a two-variable transfer function .
-
Self-noise and thermal noise floor. The Fluctuation-Dissipation theorem predicts that the same damping coefficient that determines also sets the Nyquist thermal noise force . High (low ) microphones therefore have lower self-noise — a direct physical link between frequency response shape and noise floor specification.
-
Vector cardioid and coincident-pair stereo. The polar pattern is a scalar function. Real coincident microphone arrays (XY, ORTF, Mid-Side) multiply polar patterns across multiple capsules to synthesise arbitrary stereo images. The mathematical framework is the spherical harmonic decomposition of the sound field, connecting back to the eigenfunction expansions of EP02 .
Academic References
-
Kinsler, L. E., Frey, A. R., Coppens, A. B., & Sanders, J. V. (2000). Fundamentals of Acoustics (4th ed.). Wiley. Ch. 2–4 (damped oscillator, acoustic transducers).
-
Beranek, L. L. (1954). Acoustics. McGraw-Hill. §3 (acoustic impedance and the mass-spring-damper analogy for microphones).
-
Shure Inc. (2003). Microphone Techniques for Recording (Application Guide). Available at shure.com. (SM58 frequency response and Q interpretation.)
-
Neumann GmbH. (2019). U 87 Ai Technical Data Sheet. Sennheiser/Neumann. (U87 presence peak near 10 kHz.)
-
Oppenheim, A. V., & Willsky, A. S. (1997). Signals and Systems (2nd ed.). Prentice Hall. Ch. 9 (Laplace transform and transfer functions).
-
Stearns, S. D., & Hush, D. R. (2011). Digital Signal Processing with Examples in MATLAB (2nd ed.). CRC Press. Ch. 3 (second-order systems and Bode plots).
-
Rumsey, F., & McCormick, T. (2014). Sound and Recording: Applications and Theory (7th ed.). Focal Press. Ch. 11 (microphone types and polar patterns).
-
Sessler, G. M. (1999). Acoustic sensors. Journal of the Acoustical Society of America, 105(2), 1139–1143. (Physical review of condenser and dynamic transduction mechanisms.)
-
Eargle, J. (2004). The Microphone Book (2nd ed.). Focal Press. (Industry reference for polar patterns, frequency response measurement, and Q in real capsule design.)
-
Carlson, G. E. (1998). Signal and Linear System Analysis (2nd ed.). Wiley. Ch. 6 (stability, poles, BIBO).